Well, when you think about it I guess this really isn’t the best title for my article. I mean, we know the sun is out for at least part of the year here, and we know that apparently there are solar panels all over the country producing clean power harvesting the energy of the sun as we speak.
I guess a much more accurate title for this article would be “To what extent does solar power work in Kentucky compared to other places like the West Coast, or the Northeast; Considering weather patterns, cost of electricity, and solar legislation in this region.” While this is a much more descriptive title, I highly doubt it would have been click bait for my readers. Anyways for those of you with an interest into the specifics of solar power in KY and how feasible it may be, this is for you!
If you visit anywhere from the west coast, to AZ, TX, CO, or even the east coast states like NC, SC, MD, PENN, NY, MASS you will literally see solar panels everywhere! So why have most of you reading this never seen a functioning solar panel? To answer your question, there are 4 main factors in any given solar market that will determine the success/viability/savings of solar at a specific time. After listing these factors, we will dive into each one separately and see how the Kentucky Solar market should hold up compared to others.
-
State/Utility legislation for solar.
-
Amount of sun in region on a yearly basis.
-
Cost of electricity in region.
-
Overall acceptance of solar in area.
Statewide/Utility Legislation for Solar: A+
This may come as a surprise to you, but Kentucky currently has some of the best legislation for solar customers in the nation. This is a fact. We can consider 2 things when looking at how state-wide legislation affects the local solar market. Does the State have any tax credits for purchasing a solar system? And what does the Net Metering Program look like in the state? The answer to the first question is yes. Kentucky has a $500 tax credit that will come off your state income tax. This is fairly low for a state tax credit when we look at other markets, however it is the answer to the second question that gives Kentucky the upper hand in this category. The “Net Metering” laws are better in Kentucky than virtually anywhere else in the nation. Here we are allowed to connect our solar system to our electric company’s grid (just like your home is connected to the grid now). It is called a “net” meter because the meter will go forward and backwards. During the day when the panels are cranking out power, but no one is home to use it, you will send all the extra production back to the grid and your electric company will credit your bill at the full retail value. The extra energy stored up will roll over month to month and year to year. This set up allows us to overproduce in the summer months, ensuring that we have enough built up credits to get us through the winter months when the solar system is not producing quite as much. I have personally worked in the solar market in 4 different states for at least a year each (CA, AZ, TX, KY) and no one currently has a more beneficial “NET Metering” program than Kentucky. This make solar feasible in the area even though we may get less sun than other markets, by eliminating the need for and upfront cost of battery backups.
Amount of Sun in Region on Yearly Basis: C+
This is the big one right here. I am one year into my mission of bringing solar to thousands of homes all over Kentucky and so far this has been the biggest misconception that people have about solar. I’ve found that the first reaction to many people in this area when they are approached about solar tends to be something like “we don’t get enough sun here” or “that only works out west”. First of all, let me say this; the amount of electricity that your solar system will produce is not an exact science, and there are certain variables that come into play (with weather, and the direction the panels face being the main factors). However, if we know the power rating of the solar system (total wattage), and we know the longitude and latitude of the location, then we have numerous resources that will factor in local weather patterns, and generate very conservative, bare minimum production numbers.
In the solar industry we have a value for each job based on its geographic location. This value illustrates how much our weather effects our production compared to other places. This value is a ratio, and is the
total kWh produced/total wattage of the system. Keep in mind that we consume kilowatt-hours (kWh), and this is what we are billed for by our electric company. For example, based off weather patterns in Louisville, a 10,000 W solar system (total power rating of system) that is facing south will produce at least 13,000 kWh/year. To find our ratio we would take 13,000/10,000= 1.3 kWh per watt. The value 1.3 kWh per watt takes into account weather patterns for the year specific to Louisville as well as the direction they are facing.
When compared to other markets around the solar industry, this value is slightly below average which is why we have received a C+ in this category. To compare, I spent about 4 years handling the sales for a solar company with offices in Tucson, AZ and San Antonio, TX and both areas as you would expect were significantly higher because of the increased sunlight. San Antonio had a ratio of 1.6 kWh per watt, and Tucson was more like 1.8 kWh per watt. This means the same 10,000 W solar system that will produce 13,000 kWh here in Louisville, would actually produce closer to 16,000 kWh in San Antonio, and even up to 18,000 kWh in Tucson. That translates to an additional $300-$500 savings per year for the same exact system size in the different areas. At first glance this would make sense as to why we don’t see much solar in KY at all, because it doesn’t produce as much as it does out west, but what about the Northeast states that have exploded in solar? Places like Pennsylvania, New York, Massachusetts, North Carolina all have kWh/watt ratios between 1.2-1.5 and all have already seen massive steps forward in their solar market.
So yes, there are definitely places that work better for solar production, but there are also places not as good that have 10 times more solar than we do. All projections and numbers we show to clients are based on local weather patterns and serve as bare minimums. Many people will see these numbers and think it looks good on paper, but they just don’t trust a solar system to produce as much as it will in this weather. To back this up my company offers a money back guarantee on the production for the first 3 years to ensure that we get off to a great start, as well as free service calls if needed for 5 years.
Cost of Electricity in Region: B-
Once again, we have multiple factors that go into this category. The solar systems that we install at Pure Power Solar produce kilowatt-hours, which is what your home consumes as electricity. Based off the specifics we discussed in the last section I know what the kWh production will be for a given job, however in order to know the actual dollar value of the solar savings produced we need to factor in how much a kWh costs in the given region. Obviously, in places with higher costs for electricity, solar becomes more and more feasible as the money saved is greater. After we consider the cost of energy in the region, we will also want to look at the rate at which the costs of electricity is rising for the area.
Here in Kentucky, when it is all said and done most electric suppliers are charging right around $0.10/kWh retail. Now we know that the 10,000 W solar system discussed earlier that produces 13000 kWh in Louisville will save a homeowner $1,300/year. 1National average for cost of electricity is $0.1188/kWh, so we are slightly below the national average. Going back to my past experiences again, Texas was right at $0.115/kWh and Arizona was closer to $0.13/kWhr so once again the savings are larger in these regions. This again shows why we do not see as much solar in Kentucky, but what about a place like the state of Washington? 2Washington has an average cost of electricity of $0.076/kWh but they have over 4 times the amount of solar installed state-wide as Kentucky does (125 megawatts in Washington compared to 30 megawatts total In Kentucky.)
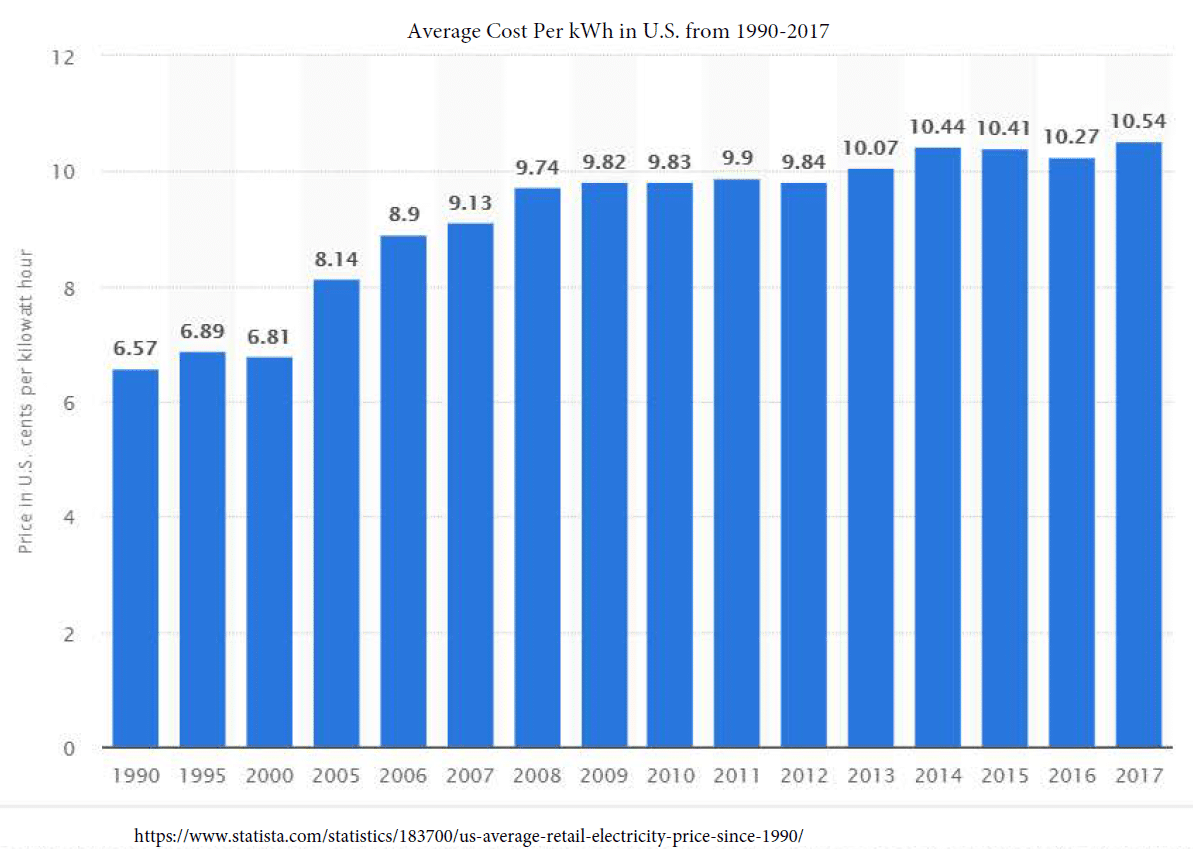
We know that Kentucky is just barley below the national average for electricity prices, but how fast is the cost of energy rising in our state? With a system that is going to last well past 25 years, it is necessary to include rising energy prices if you want to get realistic long term savings projections. What we find is that while KY is currently under the national average for energy costs, this will not be the case for long. When we go back to see all the rate changes that LGE&KU have filed with Public Utilities commission over the past 20 years we find that our price for energy is rising faster than most places and should pass the national average within the next 4 years. Going back through every rate change since the early 1990’s we find an average yearly increase in energy costs of about 4.5%/year. Texas for instance has an unregulated energy market where people actually have a choice between energy companies. Because of this competition, energy prices in Tx have not risen much at all over the past 20 years (only at a rate of 1.4%). In KY however, our energy market is regulated and consumers do not have a choice as to who will provide them with energy. The Lack of competition in markets like this allow for the higher yearly increases in energy costs. This makes the long term solar savings actually more feasible in a market like Kentucky as opposed to Texas.
Even with the lower cost of electricity, and the lower production for solar in Kentucky, we can still see a full return on your investment between 8-11 years with everything guaranteed for 25 years. So what is holding the KY solar market back?
Overall Acceptance of Solar in the Region: D
In the end, the major roadblock keeping Kentucky from having a thriving residential solar market comes down to preconceived notions many people hold in this area. Other than people simply not believing the systems will produce what is projected, despite the clear facts behind these numbers, many people also come into a solar conversation with the idea that they are not aesthetically pleasing on a home either. This comes down to personal opinion, however one’s feelings towards solar panels tend to drastically shift as the market opens up and people begin to see them more and more. In my experience over the past 6 years I have watched places quickly go from no solar to seeing these systems everywhere you look. At Pure Power Solar we believe the stars are beginning to align for the local solar market, and it will only be a matter of time before this happens here. We can now offer top of the line systems with 25 year guarantees from very reputable manufacturers (Hyundai and Panasonic) at prices cheaper than the market has ever seen. About a year ago we realized that the numbers were beginning to really make sense in Kentucky. When I saw the costs of equipment reach a point where we could run a profitable solar business here, while charging a price that would give homeowner’s an 8-10 year payback, I knew it was time to move back to my hometown of Louisville, KY and begin the journey to solarize the city. Here we are a year into the journey, with a lot of work ahead!
In conclusion, when we average out our 4 grades for the Kentucky solar market we end up with a solid B, yet still find ourselves in close to last place nationwide for solar installs. Our mission is to change that. Granted, we don’t have an A+ as many markets would, so maybe solar isn’t the best choice for every single person, but many of you are simply missing out on money by continuing to buy your energy every month from an electric company. Do you plan on living in your home for over 5 years? Are you in the process of planning a forever home for your family? Are you tired of spending $200-$300 on electricity month after month without any end in sight? We pay off our homes, and our cars, and our credit cards, but no one thinks of electricity expenses as debt. Technically it is not debt, however most people are going to spend between $60,000-$75,000 on energy over the next 25 years no matter what. In the past there has been no other way around this expense. I started Pure Power Solar to show people from my hometown that there is another option, and it many cases it makes much more sense to invest in a solar system.
If you have any interest in learning more about eliminating your electricity expenses please reach out to us. By providing us with your address we are able to geolocate your home on our software program and design a solar system on it. I will then reach out for a 15 minute phone conversation to ask a few questions and provide you with basic information for your home. At this point if your interest is peaked we can schedule a time for myself to come to your home and go over all of the specifics dealing with a solar project in person.
Thanks for your time.
Nick Hartnett – owner
5023561806
1 https://www.chooseenergy.com/electricity-rates-by-state/ , https://www.seia.org/states-map
2 https://www.chooseenergy.com/electricity-rates-by-state/